This is a continuation from part 3 about Adwords Reporting in Power BI…
So I have demonstrated how to consume Adwords data via Google Big Query in Power BI and replicate existing Adwords Datalabs reports.
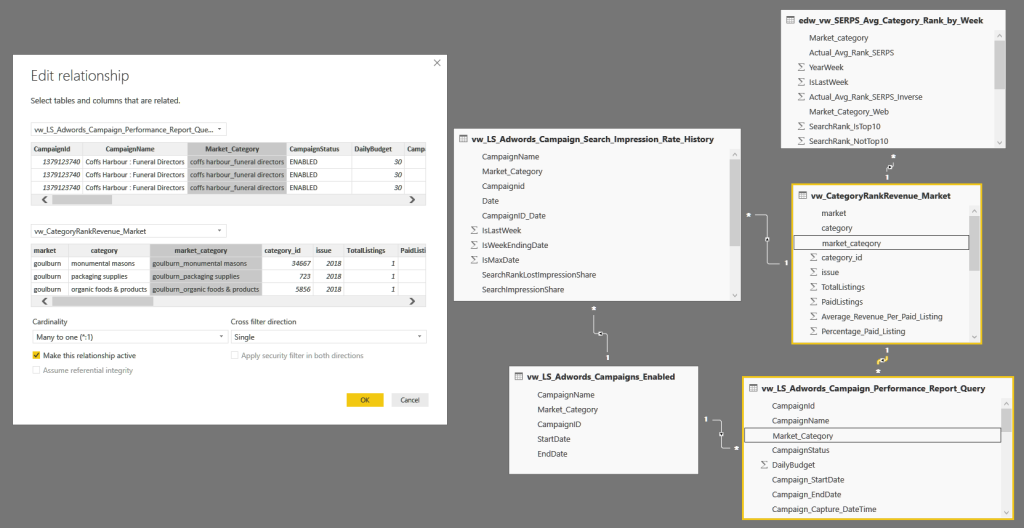
Now we want to mash our data with other data and need to find something common to join on for modelling in Power BI. In our case we are combining Advertising Revenue (Filemaker) and Search Performance data (SERPS) history data from our Microsoft SQL data warehouse.

The common thread for us was Region (Market) combined with the Category. The Market is usually a group of suburbs traditionally used to produce our phone books. The Category is traditionally a grouping of service offerings in our phone books, but in the digital media and search realms, has come to mean a grouping of keywords. So combining Market & Category, we now have a way to join these data sources (for example Gold Coast_Plumbers).
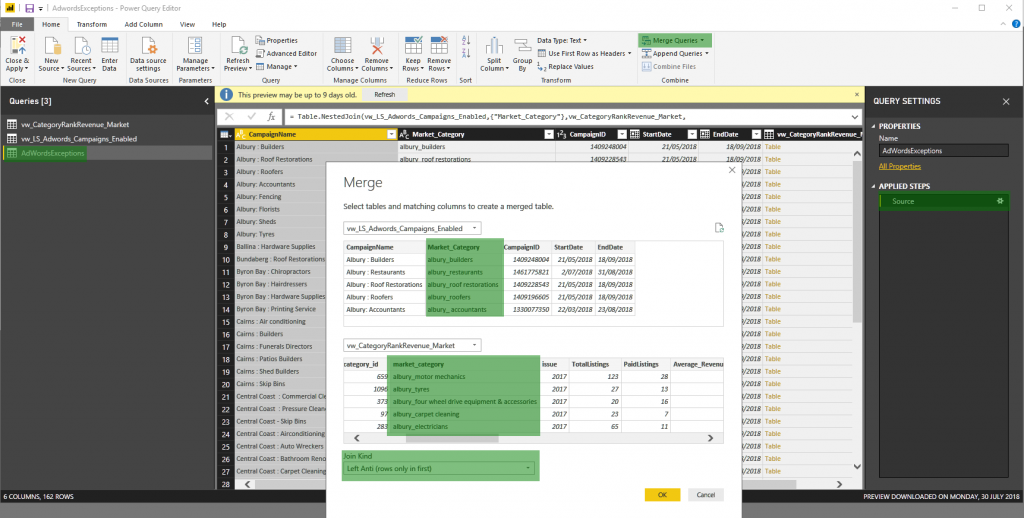
Now we have this to join on, we needed to ensure our Adwords Campaigns were named correctly, and started by producing a “Exceptions Report” in Power BI to highlight those that were not matching. This gave me an excellent opportunity to test the merge feature in Power BI and also the new functionality released in July 2018 to mix data from DirectQuery & Import Sources. I wanted to just provide a list of those campaigns in AdWords without a match in our Category Revenue data, so I used a “Left Anti (rows only in first)” as shown below.

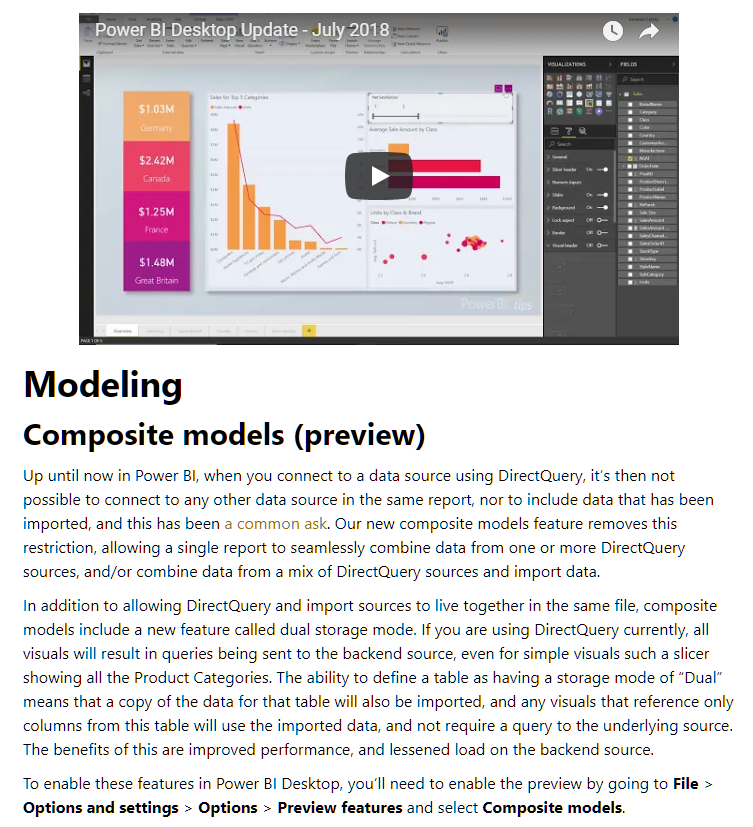
Merging in Power BI is covered better than I could try and explain in this video with Will Thompson
Now this was all well and good until I went publish this to the Power BI service, and discovered the report would not refresh, because they are from mixed sources – Import (SQL) versus DirectQuery (AdWords). After following up with Microsoft, I discovered composite modelling is something just added in the July 2018 preview as a preview feature and is not yet usable in the service, but is under development. As a developer I am happy to work around these short-coming by running this report manually as I need it until this features is made available.
The speed of change, and constant addition of new features shows Microsoft is listening to it’s users and should be commended for this. It makes the product fun to work with and I feel like I am playing a part in the improvement of the product.
So now we have an exception report to try and make sure the data from our various sources match, and when they do match, we now are able to gain new insights to help measure, manage and inform our AdWords spending. In my next post I will share how I approached this…
AdWords + Power BI Part 5 – What does this all tell us?
